Blind Spots in the Machine: How Enterprises Are Losing the Battle for Production Visibility
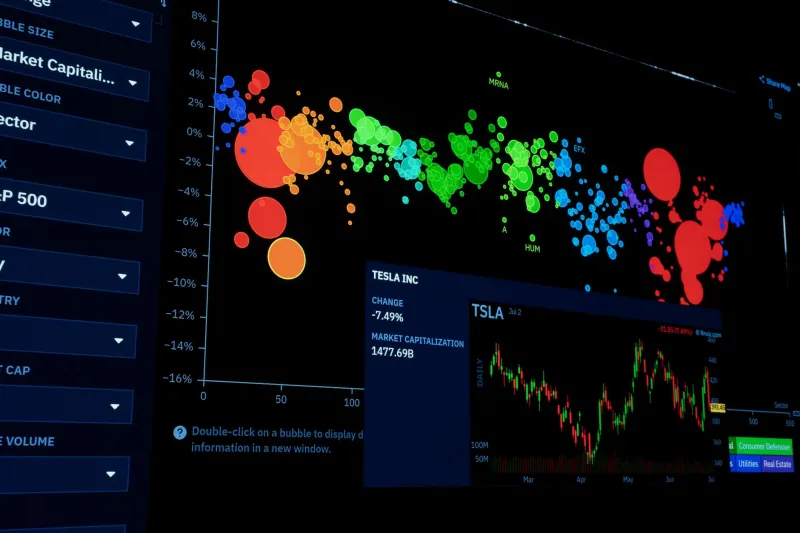
There is a particular kind of organizational confidence that forms around a wall of dashboards. Green indicators, tidy graphs, and alert thresholds calibrated by a team that worked hard to get them right. For many enterprise IT departments, this configuration represents the completion of a monitoring initiative—a box checked, a budget spent, a problem solved.
Then production breaks in a way none of those dashboards anticipated, and the scramble begins.
This scenario plays out with remarkable frequency across enterprises of every size and industry. The monitoring infrastructure exists. The data flows. Yet when a cascading failure emerges in a distributed system, the teams responsible for resolving it often spend the first critical hour simply trying to understand what is happening—not fixing it. That delay is not a personnel problem. It is an architecture problem, and it has a name: the observability gap.
Monitoring and Observability Are Not the Same Thing
The terms are frequently used interchangeably in vendor materials and internal documentation, which contributes significantly to the confusion. Monitoring is the practice of collecting and displaying predefined signals—CPU utilization, error rates, request latency, queue depth. These signals are valuable. They are also inherently limited by what the engineers who configured them thought to measure in advance.
Observability is a different concept entirely. Rooted in control theory, it refers to the degree to which the internal state of a system can be inferred from its external outputs. In practical terms, an observable system is one that allows engineers to ask questions they did not know they needed to ask—and receive meaningful answers. This distinction matters enormously when the failure mode is novel, which in complex distributed environments, it almost always is.
Traditional monitoring tells you that something is wrong. Observability tells you why, where, and how the condition developed. One reactive, one diagnostic. Enterprises that conflate the two tend to invest heavily in the former while remaining structurally blind to what they actually need.
Why Distributed Systems Expose the Limits of Legacy Approaches
A decade ago, the monitoring challenge was considerably more tractable. Applications ran on a smaller number of servers, failure domains were easier to isolate, and log files—however imperfect—could often be read sequentially to reconstruct an incident. That world has largely disappeared from the enterprise landscape.
Modern enterprise architectures are distributed by design. Microservices communicate across network boundaries. Workloads shift between cloud regions. Containerized processes spin up and terminate faster than any human operator can track. In this environment, a single user-facing transaction may touch dozens of services, each generating its own logs, each subject to its own latency, each a potential point of failure.
Correlating those signals after the fact—or in real time during an incident—requires more than a collection of individual monitoring tools pointed at individual components. It requires instrumentation that produces connected, contextual data: structured logs that carry consistent identifiers across service boundaries, distributed traces that follow a request through its entire lifecycle, and metrics that can be correlated with both.
This triad—logs, traces, and metrics—forms the foundation of what the industry has come to call the three pillars of observability. Enterprises that have invested in all three, and critically, in the tooling to correlate them, are measurably better positioned to identify and resolve production issues before they escalate.
The Organizational Dimension Most Leaders Overlook
Technology alone does not close the observability gap. Instrumentation must be treated as a first-class engineering concern, not an afterthought applied after deployment. This cultural shift is where many enterprise programs stall.
Development teams, under pressure to deliver features on aggressive timelines, frequently deprioritize the work of making their services observable. Telemetry data is inconsistently structured. Trace identifiers are not propagated across service calls. Log formats vary between teams in ways that make automated correlation difficult or impossible. The result is a system that generates enormous volumes of data while remaining functionally opaque.
Addressing this requires explicit organizational commitment. Observability standards must be defined, enforced through code review and CI/CD gates, and treated with the same rigor applied to security or performance requirements. Teams that build services should own the visibility of those services in production—a principle that aligns naturally with the DevOps model many enterprises have already adopted in name, if not always in practice.
A Practical Framework for Closing the Gap
For enterprises looking to move from monitoring to genuine observability, the path forward involves several concrete steps.
Audit current instrumentation honestly. Before purchasing additional tooling, assess the quality and consistency of existing telemetry. Identify which services lack distributed tracing, which log formats are non-standard, and where correlation across service boundaries breaks down. This audit frequently reveals that the problem is not insufficient data, but inconsistent data.
Standardize on structured, correlated telemetry. Adopt a consistent logging format—JSON-structured logs with propagated trace and span identifiers—across all services. Implement distributed tracing using an open standard such as OpenTelemetry, which has emerged as the vendor-neutral choice for enterprises seeking to avoid lock-in.
Invest in context, not just volume. More data is not inherently better. Telemetry that carries rich contextual metadata—environment, service version, deployment identifier, user segment—is exponentially more useful during an incident than high-volume but context-free log streams.
Build for unknown failure modes. The value of observability is precisely its capacity to answer questions that were not anticipated at instrumentation time. Design telemetry strategies with this principle in mind, prioritizing flexibility and query capability over rigid, predefined dashboards.
Establish mean time to understand as a metric. Organizations that measure MTTR—mean time to resolution—without also measuring the time spent simply diagnosing an incident are optimizing incompletely. Tracking how long it takes teams to understand the nature of a failure, not just resolve it, surfaces the observability gap in quantifiable terms.
The Cost of Remaining Blind
Production outages carry direct financial consequences—lost revenue, SLA penalties, emergency labor costs. They also carry less visible costs: customer trust eroded, engineering morale diminished, and leadership confidence in the technology organization quietly undermined.
Enterprises that continue to treat monitoring as synonymous with observability will continue to experience incidents that could have been resolved faster, or avoided entirely, with better visibility infrastructure. The gap between what organizations believe they can see and what is actually running in production is not a minor inefficiency. It is a structural risk embedded in the architecture of the modern enterprise.
Closing that gap is not a single-quarter initiative. It is a sustained engineering discipline—one that pays dividends in reduced incident duration, faster release confidence, and an organization that can finally trust what its systems are telling it.